
Figure 7.
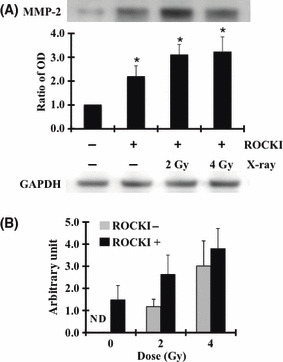
Induction of MMP2 expression by ROCK inhibitor (ROCKI). The expression of MMP2 was analyzed by western blotting (A). Quantitative densitometric results are shown. The data represent the mean ± SD of samples (n = 3). *P < 0.05 versus control. Quantification of MMP2 mRNA was performed using RT‐PCR (B). The data represent the mean ± SD of samples (n = 3). ND, not detected.