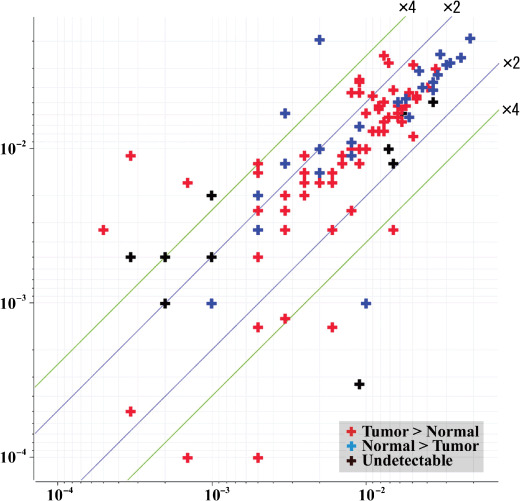
Figure 4.

The scattergram demonstrates the correlation between the intensity of duplicate antibody signals of the 24 proteins found to be overexpressed in the microarray analysis. The intensity values of the proteins found to be overexpressed in tumor tissues in the microarrays showed high reproducibility, irrespective of whether these microarray results were discordant (R = 0.7666) or concordant (R = 0.6921) with western blotting results, or whether these proteins were not detected by western blotting (R = 0.6317). X‐axis, intensity of one spot of duplicate spots; Y‐axis, intensity of other spot of duplicate spots.
