
Figure 5.
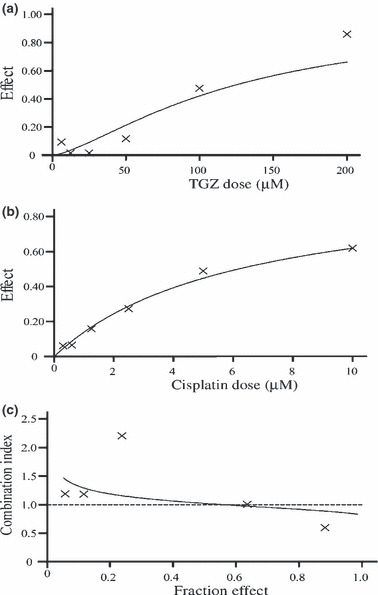
Analysis of the combination of troglitazone (TGZ) and cisplatin in EHMES‐10 cells. (a) Dose‐effect curves for TGZ. (b) Dose‐effect curves for cisplatin. (c) The fraction‐effect versus combination index (Fa‐CI) curve calculated with the CalcuSyn software.