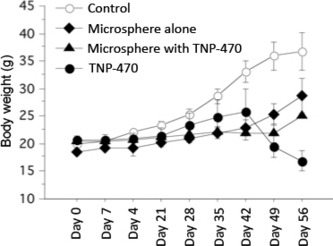
Figure 6.

Body weights of mice during various treatments. Each curve represents the mean ± SD of mice body weight (g) in each group. The mean body weight on day 56 of the mice treated with TNP‐470 alone was significantly lower compared to the group treated with TNP‐470‐loaded microspheres.
