
Figure 3.
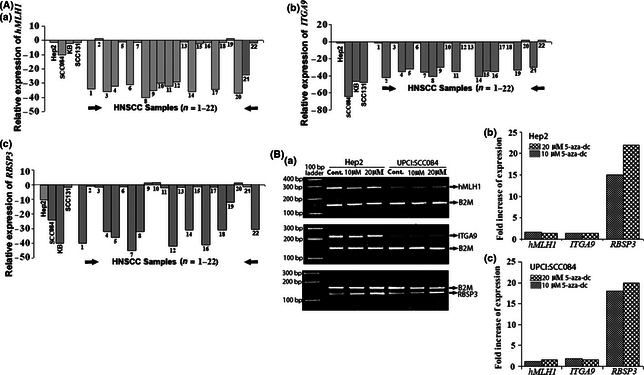
(A) Quantitative RT‐PCR analysis of mRNA expression of the candidate genes. Bars represent fold reduction of mRNA expression of the candidate genes. (B) Semi‐quantitative (a) and quantitative RT‐PCR (b,c) analysis of mRNA expression of the candidate genes in Hep2 and UPCI:SCC084 cell lines. Bars represent increase of fold expression of the respective genes in 5‐aza‐2′‐deoxycytidine (5‐aza‐dC) treatment compared to the untreated control.