
Figure 1.
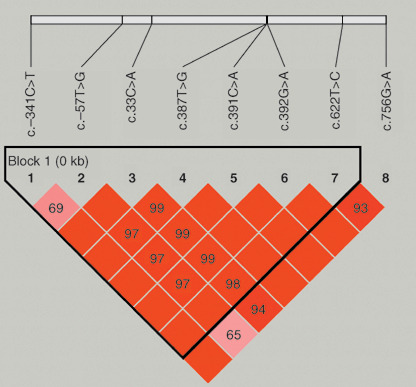
Linkage disequilibrium (LD) pattern for the UGT1A7 gene in 781 unrelated subjects. Haplotype block structure, as depicted by Haploview software program version 3.2, is shown. The numbers in boxes indicate pair‐wise D′ values and the box color changes (orange to red) are according to increasing D′ values. Bright red represents strong LD.