
Figure 2.
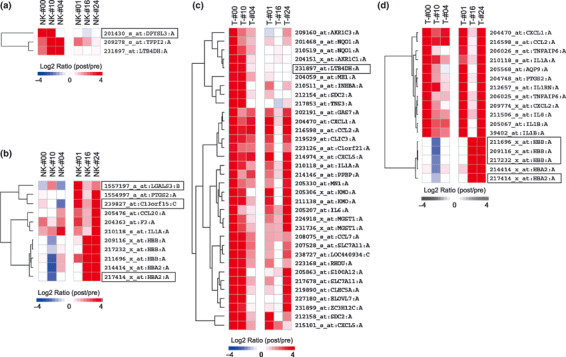
Differential gene expression analysis in CD56−CD3+ T cells and CD56+ cells between pre‐ and post‐treatment samples. Gene expression levels were normalized, log2‐transformed and mean‐centered to produce relative values. Each column represents the pooled samples from three different patients (good responders: #00, #10, #04; poor responders: #01, #16, #24). Upregulated genes are shown in red, and downregulated genes are shown in blue. The color bars (bottom) relate to the intensity of the differences in gene expression. (a) Upregulated genes in CD56+ cells and (c) CD56−CD3+ T cells of the good responder group. (b) Upregulated genes in CD56+ cells and (d) CD56−CD3+ T cells of the poor responder group. The squares are selected genes where at least two out of three counterpart cases of microarray analyzed cases were decreased (log2 ratio <0). NK, CD56+ cells; T, CD56−CD3+ T.