
Figure 4.
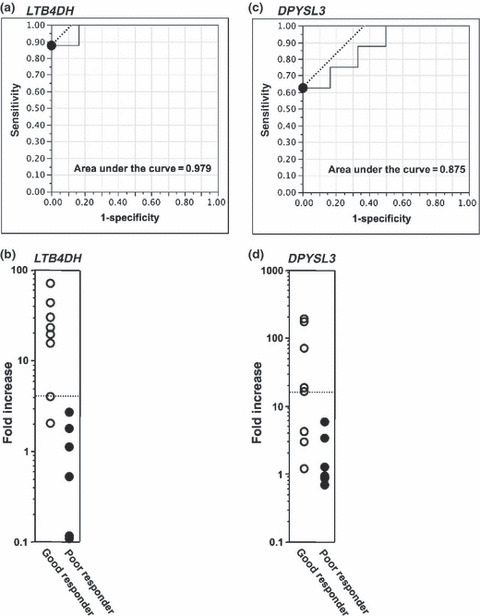
Determination of the cut‐off level of the fold increase in LTB4DH and DPYSL3 expression. The fold increase in gene expression including LTB4DH in CD56−CD3+ T cells (a,b) and DPYSL3 (c) in CD56+ cells is shown. The receiver‐operating‐characteristic (ROC) curve was calculated in order to obtain the highest cut‐off value in both specificity and sensitivity. The black circles in (a) and (c) were the highest point of both specificity and sensitivity. The area under the curve is also indicated in the panel (a) and (c). The dotted lines in (b) and (d) indicate the cut‐off fold increase value of each gene.