
Figure 3.
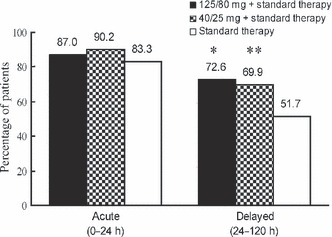
Percentage of patients with a complete response (no emesis and no rescue therapy) in the acute phase (day 1) and the delayed phase (days 2–5). *P < 0.001 versus standard therapy group. **P < 0.01 versus standard therapy group.
Official websites use .gov
A
.gov website belongs to an official
government organization in the United States.
Secure .gov websites use HTTPS
A lock (
) or https:// means you've safely
connected to the .gov website. Share sensitive
information only on official, secure websites.
Percentage of patients with a complete response (no emesis and no rescue therapy) in the acute phase (day 1) and the delayed phase (days 2–5). *P < 0.001 versus standard therapy group. **P < 0.01 versus standard therapy group.