
Figure 7.
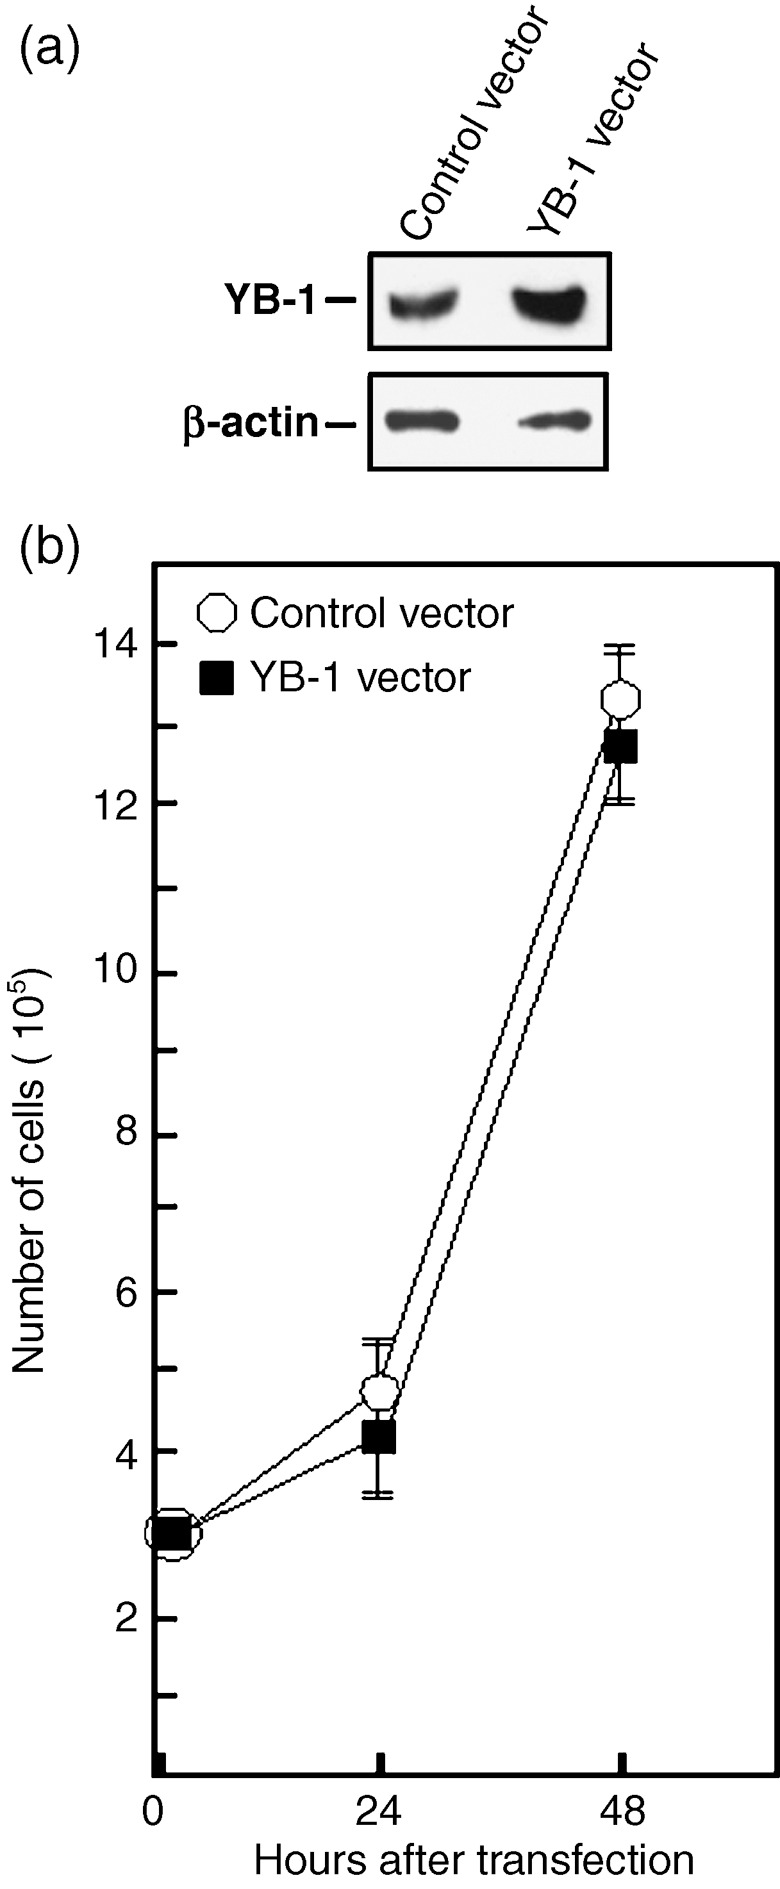
Cell growth of MCF7 cells overexpressing Y‐box‐binding protein‐1 (YB‐1). (a) Example of Western blots showing intracellular levels of YB‐1 48 h after transfection with either an empty expression vector or a YB‐1 expression vector. The anti β‐actin is used as loading control for the blot (bottom panel). On average, transfection of YB‐1 expression vector increased the levels of YB‐1 proteins by two‐fold. (b) Cell growth of transfected MCF7 cells. Cells were transfected with either an empty expression vector or a YB‐1 expression vector by electroporation with a nucleofector kit (see ‘Materials and Methods’ for details). Approximately, 3 × 10⁵ transfected cells were plated on 90‐mm Petri dishes. Cells were counted with an hemocytometer 24 and 48 h after the transfections. Results represent the mean ± SD of four independent transfection experiments. All cultures reached confluence at 72 h (data not shown).