
Figure 1.
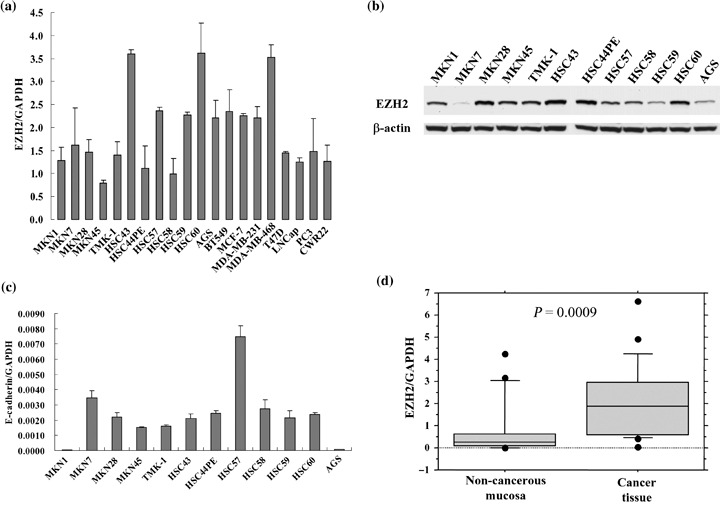
Profiling of enhancer of zeste homolog 2 (EZH2) mRNA expression in gastric cancer cell lines, gastric cancer tissue, and non‐cancerous mucosa. (a) EZH2 mRNA from cancer cells including gastric, prostate, and breast cancer cell lines was determined by quantitative real‐time reverse transcription–polymerase chain reaction (RT‐PCR). After normalizing with glyceraldehyde‐3‐phosphate dehydrogenase (GAPDH), the ratio of each cell line (mean ± SD) carried out in duplicate from two different experiments, was calculated based on the standard curve. (b) Western blot analysis showed expression of EZH2 protein in 12 gastric cancer cell lines. (c) The level of E‐cadherin mRNA expression in 12 gastric cancer cell lines was confirmed by quantitative real‐time RT‐PCR. (d) EZH2 mRNA from 22 pairs of gastric cancer and non‐cancerous gastric mucosa was determined by quantitative real‐time RT‐PCR. The values from each tissue sample were calculated as above. The significant difference between gastric cancer tissue and non‐cancerous mucosa was determined by Mann–Whitney U‐test.