
Figure 2.
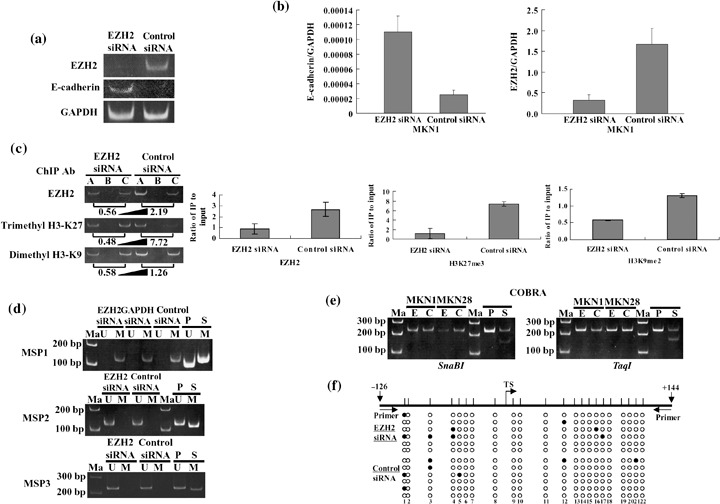
Restoration of E‐cadherin mRNA in MKN1 gastric cancer cell line after knockdown of enhancer of zeste homolog 2 (EZH2) accompanied by chromatin remodeling without DNA methylation in the promoter region of the E‐cadherin gene. (a) Restoration of E‐cadherin mRNA analyzed by reverse transcription–polymerase chain reaction (RT‐PCR) in MKN1 cells was visualized with 6% polyacrylamide gel electrophoresis. GAPDH, glyceraldehyde‐3‐phosphate dehydrogenase; siRNA, short interfering RNA. (b) The restored expression level of E‐cadherin mRNA was quantified by real‐time RT‐PCR. (c) Chromatin immunoprecipitation (ChIP) assay was carried out using DNA–protein complex isolated from MKN1 cells transfected with EZH2 siRNA for 96 h and immunoprecipitated (IP) with various antibodies. The PCR product of each IP DNA and input DNA was visualized with 6% polyacrylamide gel electrophoresis. The number under each gel is the ratio of IP DNA versus input DNA quantified. A, antibody; B, no antibody; C, input. Individual ChIP assays were repeated at least twice to confirm the reproducibility of the PCR‐based experiment. The results of ChIP assays are shown as a diagram for each antibody and statistical analyses (student's t‐test) were carried out (H3K27me3; H3‐Lys‐27 trimethylation, H3K9me2; H3‐Lys‐9 dimethylation). (d) Methylation‐specific polymerase chain reaction analyses from the DNA of MKN1 cells transfected with EZH2 siRNA (e) or negative control siRNA (c), using primer sets that specifically amplify either unmethylated (U) or methylated (M). Control templates from human genomic placenta DNA, treated with SssI methylase (S) or untreated (P), are shown. Ma, 100 bp DNA ladder marker. (e) Combined bisulfite restriction analysis (COBRA) from the DNA of MKN1 and MKN28 cells transfected with EZH2 siRNA (E) or negative control siRNA (C), using primer sets for the E‐cadherin gene. MKN28 was a positive control for E‐cadherin expression. PCR products were digested with specific restriction enzymes including SnaBI or TaqI. (f) Bisulfite sequencing of the E‐cadherin CpG island. Top, map of the CpG island. Twenty‐two individual CpG dinucleotides are indicated as vertical lines. Primer, location of bisulfite sequencing primers. Numbers indicate positions relative to transcription start. TS, transcriptional start. Bottom, each circle indicates a CpG site in the primary sequence, and each line of circles represents analysis of a single cloned allele. Black circles, methylated CpG sites; white circles, unmethylated CpG sites.