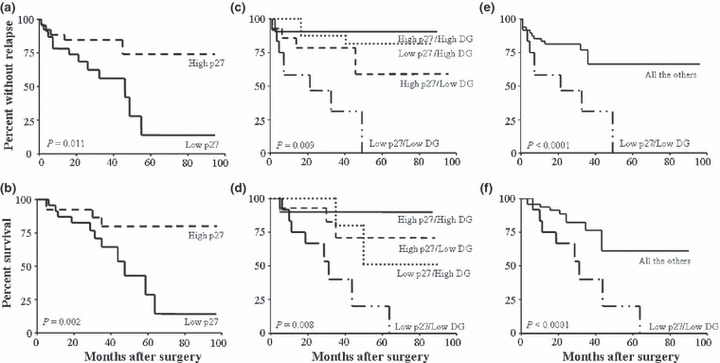
Figure 2.

Kaplan–Meier curves for disease‐free (upper panel) and overall (lower panel) survival in a series of 60 clear‐cell renal cell carcinoma (RCC) patients. Patients were stratified by p27kip1 expression (a,b) or according to the level of p27kip1 and α‐dystroglycan (α‐DG) complex expression (c–f) (see text for details).
