
Figure 2.
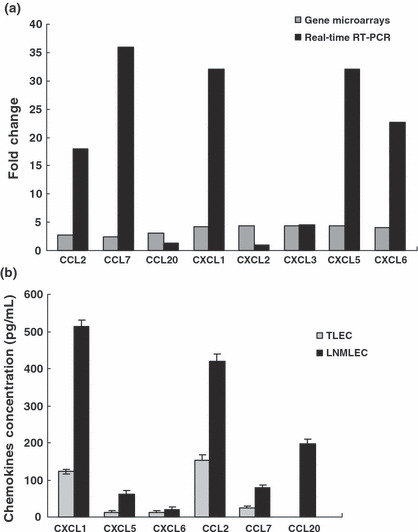
Differential expressions of the chemokines between LNMTca8113‐stimulated lymphatic endothelial cells (LNMLECs) and Tca8113‐stimulated LECs (TLECs) were assayed by gene microarrays, real‐time PCR, and ELISA. (a) Gene expressions of the chemokines in LNMLECs were distinct from that in TLECs. (b) LNMLECs secreted significantly higher levels of chemokines. Chemokine concentrations are reported as pg/mL per 100 000 cells. Mean values between two groups were compared using the t‐test. *P < 0.05.