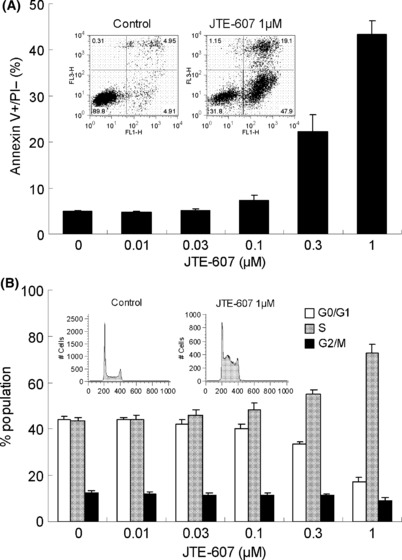
Figure 2.

Induction of apoptosis and cell‐cycle arrest by JTE‐607. (A) U‐937 cells were cultured with JTE‐607 for 2 days, and were stained FITC‐labeled anti‐Annexin V and PI, then analyzed using a flow cytometer. The bars represent the mean ± SEM of three independent experiments. (B) U‐937 cells were cultured with JTE‐607 for 1 day, and intracellular DNA levels were measured by flow cytometer after PI staining. Population in each cell‐cycle phase was analyzed by the Watson pragmatic method. The bars represent the mean ± SEM of three independent experiments.
