
Figure 1.
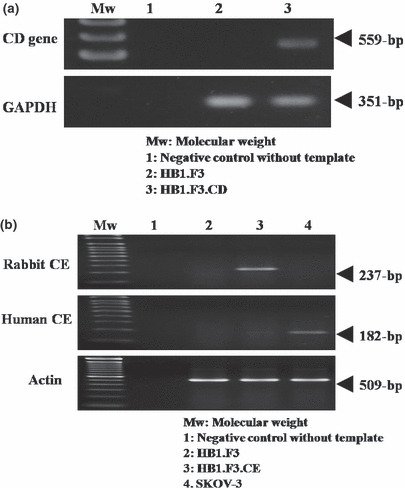
Transcriptional expression of a bacterial CD gene in HB1.F3.CD cells and a rabbit CE gene in HB1.F3.CE cells. The predicted 559 bp (CD) and 237 bp (CE) PCR products of the CD and CE genes were obtained by touchdown PCR. HB1.F3 CE cells. HB1. F3 and SKOV‐3 cells were prepared as described in Materials and Methods. (a) The expression of bacterial CD mRNA was confirmed in HB1.F3.CD cells. The HB1.F3 cells were used as negative control. (b) The expression of transfected rabbit CE mRNA was confirmed in HB1.F3 CE cells, but not in HB1. F3 and SKOV‐3 cells. GAPDH and actin were used as controls. Mw, Molecular weight standards.