
Figure 2.
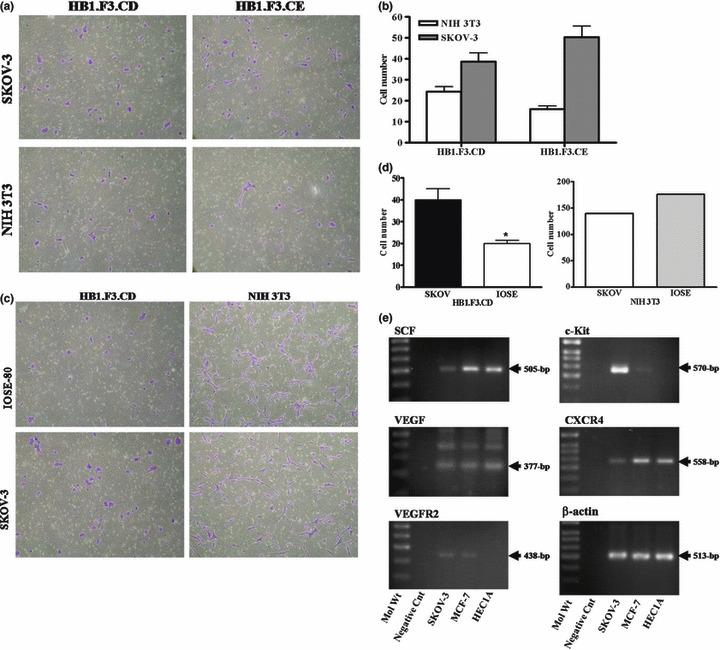
In vitro migration of HB1.F3.CD toward ovarian cancer cells. The migratory capacity was assessed by a modified transwell migration assay. The 24 well plates were pre‐coated with fibronectin and HB1.F3.CD or CE cells were added to the upper chamber of the insert after placing the transwell chamber in conditioned medium. (a and c) The conditioned medium from SKOV‐3, NIH 3T3, and IOSE‐80 cells was placed in the lower well of 24 well plates and HB1.F3.CD and CE cells (50 000/0.5 mL) were seeded in the upper well of the insert. The inserts were collected and stained as previously described. (b and d) The numbers of cells migrating into the membrane were counted using a light microscope (100×). Values are presented as the mean ± SD for three independent experiments. *P < 0.05 vs control. (e) Expression of factors potentially involved in chemo‐attractant or cell growth in cancers of the female reproductive tract. The PCR products of SCF, VEGF, VEGFR2, CXCR4, and c‐kit were obtained by RT‐PCR. Values are the mean ± SD for three independent experiments. *P < 0.05 vs NIH 3T3 cells.