
Figure 3.
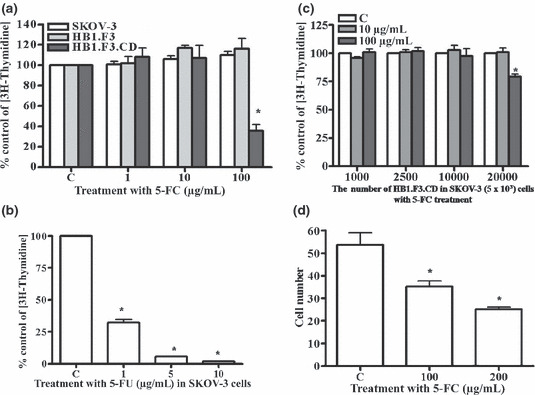
Effect of 5‐FC/5‐FU on cell proliferation. Proliferation levels at each concentration of 5‐FC or 5‐FU are expressed as relative fold change compared to controls. (a) SKOV‐3, HB1.F3, and HB1.F3.CD cells (2 × 10⁴ cells per well) were placed in plates and treated with 5‐FC at the concentrations of 1, 10, or 100 μg/mL for 4 days. (b) SKOV‐3 cells were treated with increasing concentrations of 5‐FU (1, 5, or 10 μg/mL for 4 days). (c) SKOV‐3 cells (5 × 10³) were seeded in 24 well plates. Following incubation for 24 h, increasing numbers of HB1.F3.CD cells were placed on top of inserts. After 24 h, the cells were treated with 5‐FC at a concentration of 10 μg/mL or 100 μg/mL for 4 days. (d) HB1.F3.CD cells (2 × 10⁴ cells) cultured with SKOV‐3 cells (5 × 10³ cells) were treated with different concentrations of 5‐FC (100 μg/mL or 200 μg/mL) for 4 days. Values are the mean ± SD for three independent experiments. *P < 0.05 compared with a control.