
Figure 5.
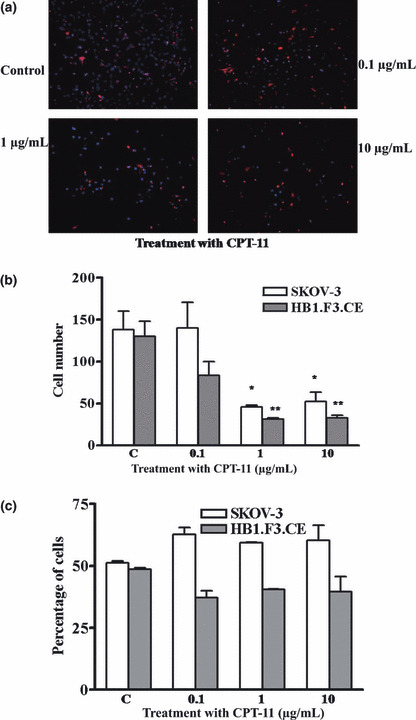
Effect of CPT‐11 on the percentage of HB1.F3.CE and SKOV‐3 cells. HB1.F3.CE cells were labeled with CM‐DiI and co‐cultured with SKOV‐3 cells at a density of 1 × 10⁴ cells, respectively. (a) Cells were treated with CPT‐11 for 24 h in a dose‐dependent manner and stained with DAPI. CM‐DiI‐labeled HB1.F3.CE cells (red cells) are shown. (b) The numbers of HB1.F3.CE and SKOV‐3 cells were quantified and presented. (c) The percentage of HB1.F3.CE and SKOV‐3 in each treatment group of cells is shown. Values are the mean ± SD for three independent experiments. *P < 0.05 vs SKOV‐3 cell controls; **P < 0.05 vs HB1.F3.CE cell controls.