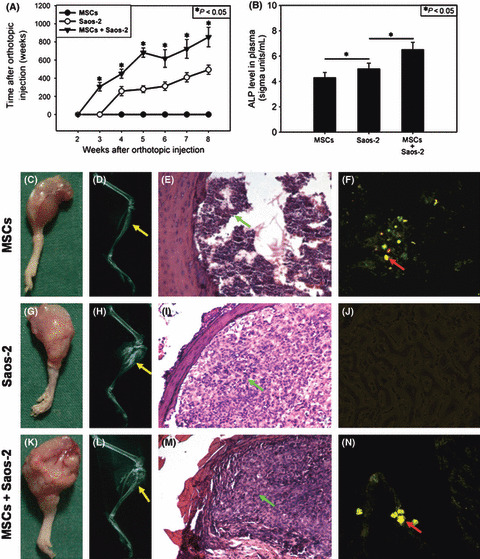
Figure 1.

Growth and progression of osteosarcoma (OS) in vivo in response to co‐injection of human mesenchymal stem cells (MSCs). (A) OS volume. *P < 0.05, hMSCs + Saos‐2 versus Saos‐2. (B) Alkaline phosphatase (ALP) in blood. *P < 0.05. (C,G,K) General observation of OS. (D,H,L) X‐ray examination. (E,I,M) Pathological analysis. (F,J,N) Fluorescent photographs. Green arrows, injected cells; red arrows, mean hMSCs labeled with GFP; yellow arrows, site of injection. Results are expressed as the mean ± SD.
