
Figure 5.
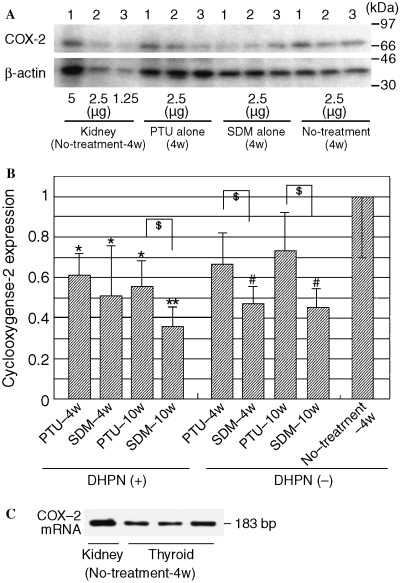
Western blot analysis of COX‐2 from thyroids of PTU or SDM‐treated rats with or without DHPN‐initiation and normal rats without any treatment, and results of RT‐PCR for COX‐2 mRNA in normal rat organs. (A) Analysis using anti‐COX‐2 monoclonal antibody reveals constitutive expression of a band in the thyroids and kidneys of rats, with or without PTU or SDM treatment. (B) Quantitative values of COX‐2 in thyroids, presented as mean ± SD, normalized for β‐actin levels in the same tissue sample. Densities for COX‐2 and β‐actin protein were calculated with analytical curves of 1.25 µg to 5.0 µg control rat kidneys for each blot. *,**P < 0.05, 0.01 compared to no‐treatment‐4w (Student's t‐test); $P < 0.05 compared to no‐treatment‐4w (Welch's t‐test); #P < 0.05 (Student's t‐test). (C) RT‐PCR results using oligonucleotide primers specific to the 3′‐terminal portion of rat COX‐2 mRNA, including the sequence lacking in the COX‐1 mRNA.