Figure 4.

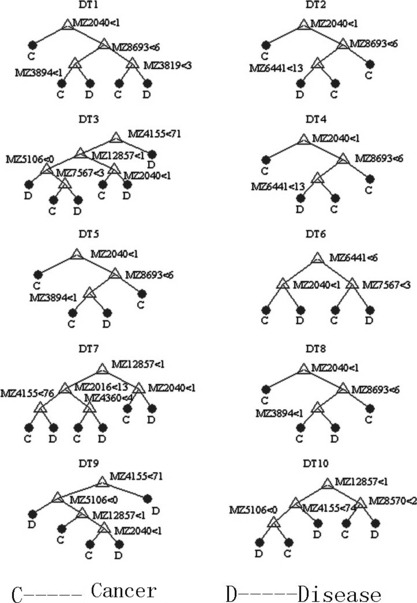
Diagram of a decision tree for the classification of pancreatic adenocarcinoma (PaCa) and benign pancreatic disease. Mass spectra from the sera of 58 PaCa and 18 benign pancreatic disease ranging from 2–30k m/z ratios.

Diagram of a decision tree for the classification of pancreatic adenocarcinoma (PaCa) and benign pancreatic disease. Mass spectra from the sera of 58 PaCa and 18 benign pancreatic disease ranging from 2–30k m/z ratios.