Figure 9.

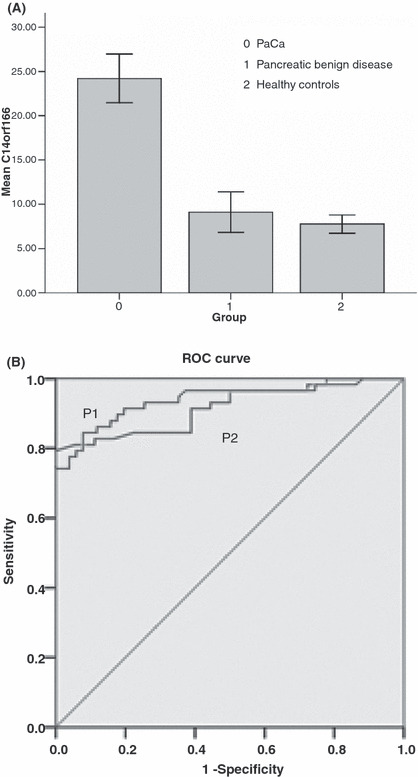
(A) C14orf16 serum concentrations from patients with pancreatic adenocarcinoma (PaCa), pancreatic benign disease, and healthy controls. Error bars, 95% confidence interval. (B) P1: receiver–operator curves (ROC) are shown for serum C14orf166 levels demonstrating the sensitivity and specificity for predicting PaCa from the healthy control (area under the curve [AUC] = 0.938). P2: ROC curves are shown for serum C14orf166 levels demonstrating the sensitivity and specificity for predicting PaCa from pancreatic benign disease (AUC = 0.917). Diagonal segments are produced by ties.
