
Figure 2.
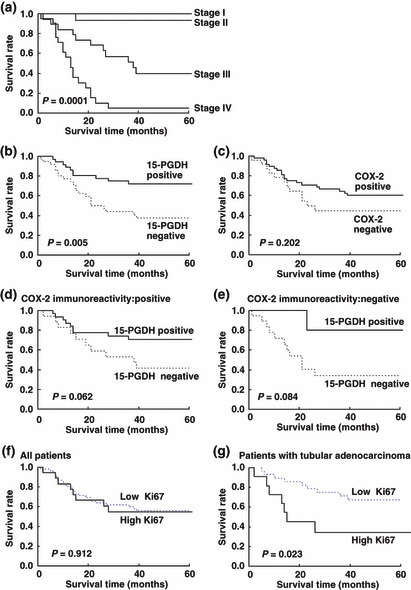
Kaplan–Meier analysis of survival according to (a) disease stage, (b) 15‐hydroxyprostaglandin dehydrogenase (15‐PGDH) expression, (c) cyclooxygenase‐2 (COX‐2) expression, (d) 15‐PGDH expression in a subgroup of patients with COX‐2‐positive tumors, and (e) in a subgroup of patients with COX‐2‐negative tumors. (f) Ki67 labeling index in all patients and (g) Ki67 labeling index in a subgroup of patients with tubular adenocarcinoma.