
Figure 3.
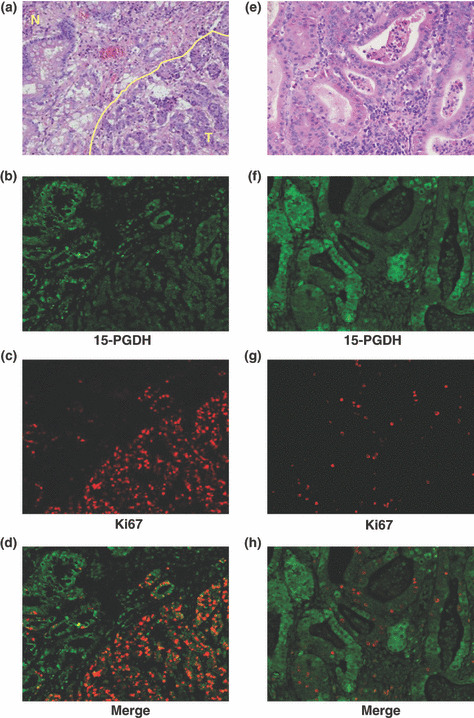
Distributions of 15‐hydroxyprostaglandin dehydrogenase (15‐PGDH) protein‐ and Ki67‐positive cells in cancer tissue. (a) H&E staining of noncancerous mucosa (N, noncancerous epithelium, upper left) and gastric cancer tissue (T, tumor tissue, lower right). (b) 15‐PGDH protein (green area). (c) Ki67‐positive cells (red dots). (d) Merged image of Fig. 2(b,c). (e) H&E staining of tumor tissue. (f) Immunoreactivity for 15‐PGDH protein was observed in tumor tissue (green area). (g) Ki67‐positive cells (red dots) in tumor tissue. (h) Merged image of Fig. 2(e,f). Ki67‐positive cells show negative or very weak immunoreactivity for 15‐PGDH.