
Figure 2.
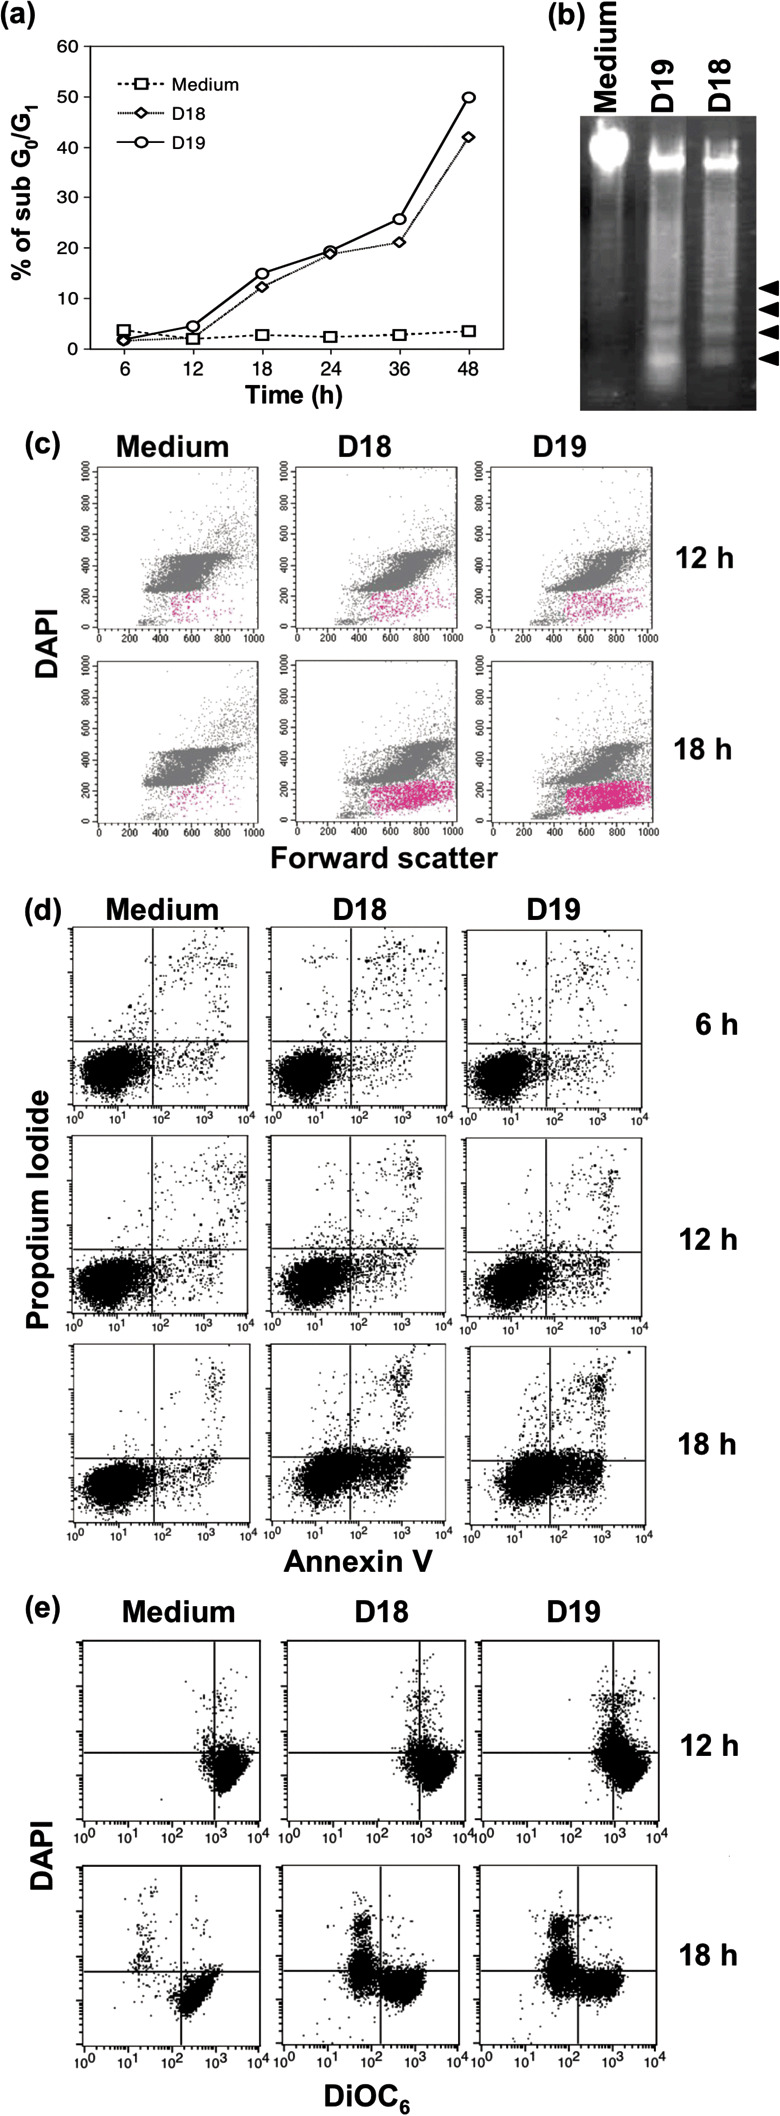
Apoptosis‐like cell death observed in DT40 cells treated with monoclonal antibodies (mAbs). (a) Cells were cultured with D18 or D19 mAb for the time indicated, stained with DAPI, and analyzed for sub G0/G1 cells by flow cytometry. (b) Agarose gel electrophoresis to detect DNA laddering in DT40 cells. The arrowheads show nucleosomal fragmentation of DNA. (c) DT40 cells were cultured with or without D18 or D19 mAb for 12 or 18 h and stained with DAPI, and 10 000 cells were analyzed by dual‐parameter flow cytometry with DAPI and forward scatter. Apoptosis‐like cell population is indicated in red. (d) Exposed PS was analyzed by staining with Annexin V fluorescein‐isothiocyanate (FITC) and propidium iodide. The percentage of cells located in right histogram quadrants is indicated. (e) Disruption of mitochondrial membrane potential (Δψ) was determined by measuring decreased DiOC6.