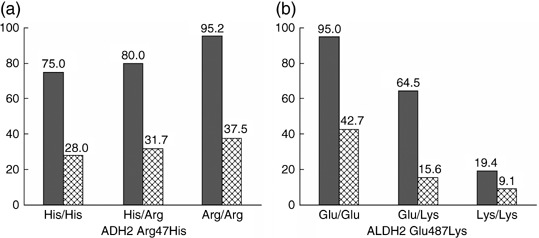
Figure 1.

Proportions (%) of alcohol drinkers for men (gray bar) and women (hatched bar) according to the ADH2 Arg47His and ALDH2 Glu487Lys polymorphisms in the control group. Values shown at the top of each bar are percentages of alcohol drinkers. Trend P‐values were 0.03 in men and 0.35 in women for the ADH2 polymorphism, and <0.0001 in both sexes for the ALDH2 polymorphism. The trend P‐value was based to the Mantel‐Haenszel method with scores of 0, 1, and 2 assigned for the number of the variant allele.
