
Figure 1.
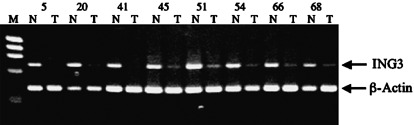
ING3 expression analysis in some of the matched tumor and normal samples. Representative raw data from the reverse transcription–polymerase chain reaction are shown. Lower band, β‐actin message (386 bp); upper band, ING3 message (703 bp); N, non‐tumor tissue; T, tumor tissue; M, size marker. Upper numbers (5, 20, 41, 45, 51, 54, 66, 68) show case numbers.