
Figure 1.
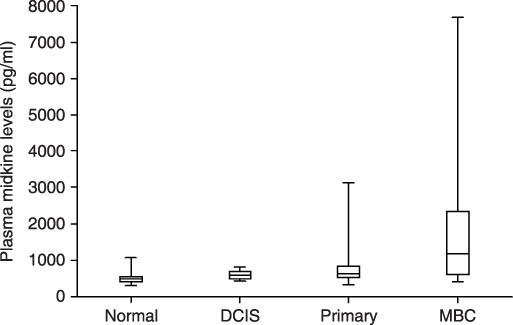
Plasma midkine levels in normal controls, ductal carcinoma in situ (DCIS) patients, primary invasive breast cancer patients, and metastatic breast cancer patients. Levels are expressed in pg/mL. Box, center bar in the box, and error bar show interquartile range, median of midkine levels, and range from minimum to maximum value. Normal: healthy volunteers; n = 104; median midkine levels = 489 pg/mL; 25th percentile = 411 pg/mL; 75th percentile = 542 pg/mL; minimum levels = 302 pg/mL; maximum levels = 1068 pg/mL; positive rate = 3.8% (4/104). DCIS: ductal carcinoma in situ, n = 11; median midkine levels = 589 pg/mL; 25th percentile = 493 pg/mL; 75th percentile = 704 pg/mL; minimum levels = 423 pg/mL; maximum levels = 817 pg/mL; positive rate = 9.1% (1/11). Primary: primary invasive breast cancer without distant metastasis; n = 11; median midkine levels = 645 pg/mL; 25th percentile = 523 pg/mL; 75th percentile = 826 pg/mL; minimum levels = 323 pg/mL; maximum levels = 3120 pg/mL; positive rate = 32.4% (36/111). Metastatic: metastatic breast cancer; n = 25; median midkine levels = 1252 pg/mL; 25th percentile = 602 pg/mL; 75th percentile = 2543 pg/mL; minimum levels = 414 pg/mL; maximum levels = 7665 pg/mL; positive rate = 64% (16/25). The Steel test showed significant difference between healthy volunteers and patients with breast cancer including DCIS (P < 0.05), primary invasive cancer (P < 0.001), and metastatic breast cancer (P < 0.001). The Steel–Dwass test also showed significant difference between DCIS and metastatic disease (P < 0.05), and between primary invasive cancer and metastatic disease (P < 0.01), but no significant difference between DCIS and primary invasive cancer.