Figure 1.

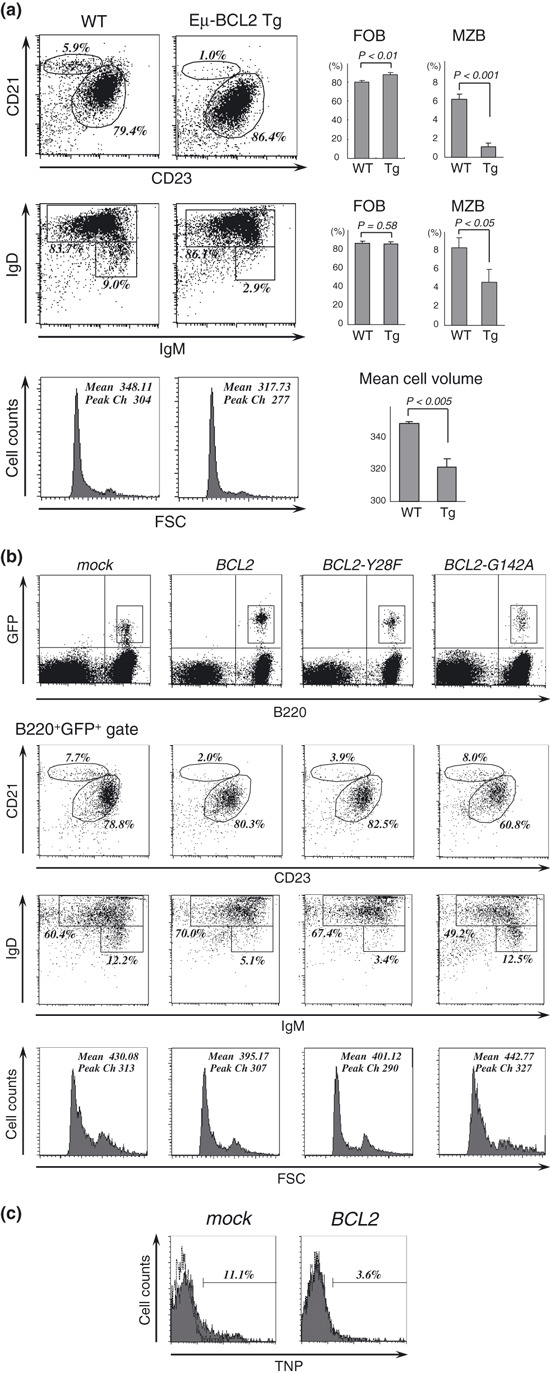
BCL2‐overexpressing B cells have a specific differentiation preference toward follicular B cells. (a) Flow cytometric analysis of the splenic B cells derived from wild‐type and Eμ‐BCL2 Tg mice. B220+ cells were gated and analyzed for marginal zone B cells (CD23lowCD21hi and IgMhiIgDlow subsets) and follicular B cells (CD23hiCD21int and IgM+IgDhi subsets). The numbers in each panel represent the percentages of the gated cells, and the bar graphs the mean percentage of each population (n = 3), with error bars representing the SDs. Forward scatter histograms of the B220+ gated cells illustrate relative cell size, with the mean fluorescence intensity and peak channels indicated. (b) Flow cytometric analysis of the splenic B cells that expressed BCL2 and its mutant genes, which were delivered by lentiviral vectors. GFP+B220+ cells were gated and analyzed for marginal zone and follicular B cell populations as shown in (a). Representative dot plots of at least three independent experiments are shown. Forward scatter histograms of the GFP+B220+ cells are shown below, with the mean fluorescence intensity and peak channels indicated. (c) TNP‐Ficoll binding assay. BCL2 or mock vector‐introduced mice were injected intravenously with TNP‐Ficoll. Thirty minutes later, GFP+ splenic B cells were analyzed for TNP‐Ficoll capturing populations. The dashed line on each histogram represents an isotype control antibody.
