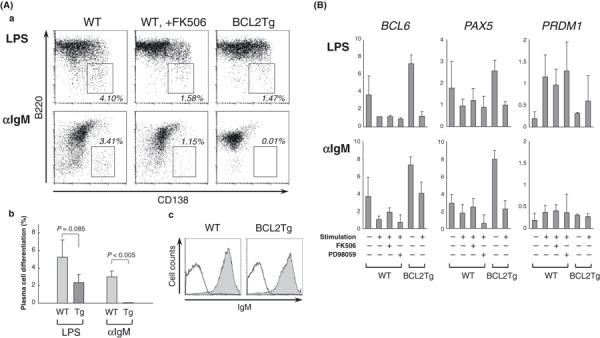
Figure 3.

Reduced responsiveness of BCL2‐overexpressing B cells during plasma cell differentiation. (A) (a) Plasma cell differentiation of the WT and Eμ‐BCL2 + B cells after a 4‐day stimulation with lipopolysaccharide (LPS) or anti‐IgM antibody in vitro. WT B cells were also stimulated in the presence of FK506 (middle panels). (b) The mean percentages of B cells that differentiated into plasma cells are shown by the columns, with error bars indicating the SDs (n = 3). (c) Histograms demonstrate surface IgM expression of WT and Eμ‐BCL2 + B cells. (B) Real‐time RT‐PCR analysis of the WT and Eμ‐BCL2 + B cells for the quantification of gene transcripts of BCL6, PAX5, and PRDM1. The cells were stimulated with LPS or anti‐IgM for 2 days, and with FK506 (1 μM) or ERK inhibitor PD98059 (20 μM) in the samples shown. The values represent the relative expression levels normalized to GAPDH. Data are the means and SDs of three independent experiments.
