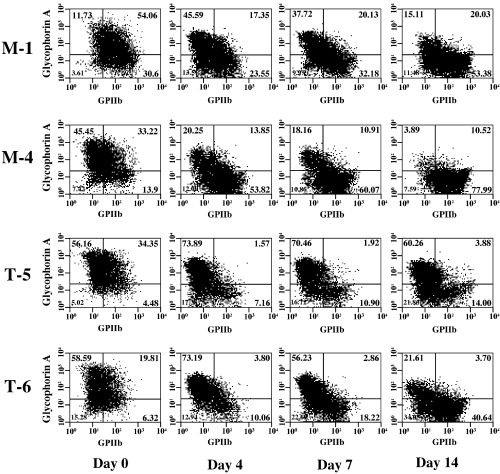
Figure 6.

Erythroid and megakaryocytic lineage‐specific surface antigen expression in the UT‐7/GM clones under the treatment with thrombopoietin (TPO). The mock (M‐1 and M‐4) and TEL‐overexpressing (T‐5 and T‐6) UT‐7/GM clones cultured in the presence of TPO (100 ng/mL) were harvested at each time point indicated (days 0, 4, 7, 14) and subjected to flow‐cytometric analysis. GPIIb on X axis and glycophorin A on Y axis were megakaryocyte‐ and erythrocyte‐specific markers, respectively.
