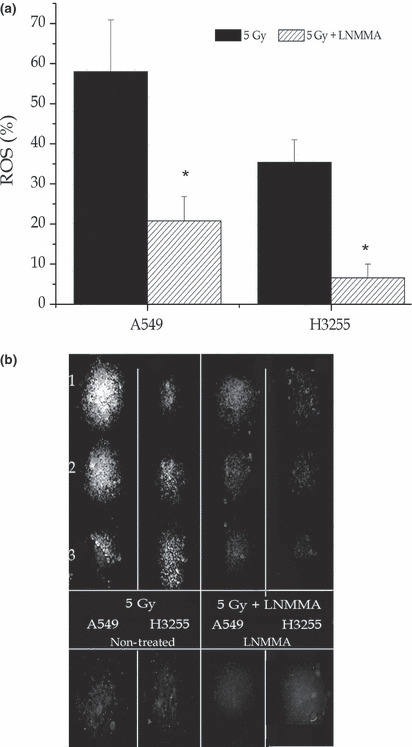
Figure 2.

Reactive oxygen species (ROS). By employing an Image‐iT live green reactive oxygen species detection assay and three cultures sets showed increased ROS levels when the cells were exposed to radiation (a,b) compared to those that were untreated (b). However, florescence was dramatically reduced following exposure to combined treatment (a,b) *P = 0.03). Values are expressed as the means ± SEM of three independent sets of data. LNMMA, N G‐monomethyl‐l‐arginine, monoacetate.
