
Figure 3.
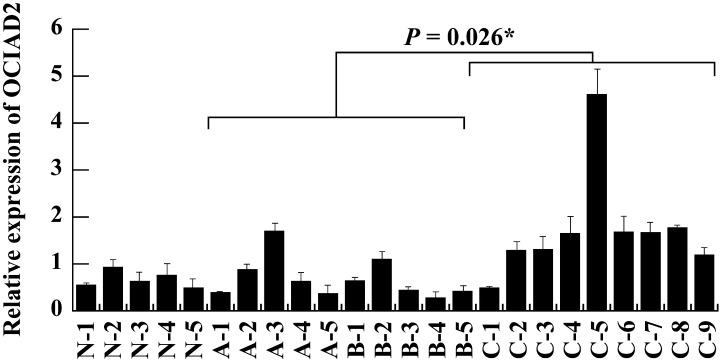
Quantitative real‐time real‐time reverse transcription–polymerase chain reaction analysis of OCIAD2 expression in small‐sized adenocarcinomas and normal lung. OCIAD2 showed significantly higher expression in type C tumors (small‐sized adenocarcinoma mixed subtype with bronchioloalveolar carcinoma [BAC] component) than in both type A and B tumors (BAC) (P = 0.026). Lane N1‐5, normal lung; A1‐3, type A; B1‐5, type B; C1‐9, type C tumor‐derived RNA samples extracted from whole section samples. All measurements are shown relative to the expression level of the glyceraldehyde‐3‐phosphate dehydrogenase (G3PDH) gene. Bars show the meanmean + SD. *The difference was statistically significant (P < 0.05).