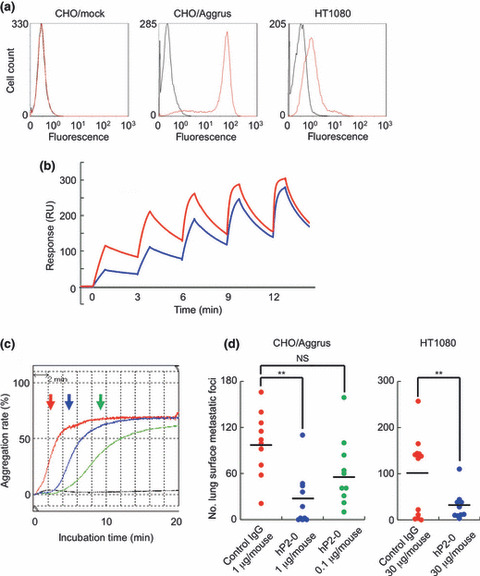
Figure 5.

In vitro and in vivo evaluation of murine/human chimeric P2‐0 (hP2‐0). (a) Cells were treated with control human IgG1 ( ) and hP2‐0 (
 ). After incubation with the Alexa Fluor 488‐conjugated second antibody, Aggrus expression was analyzed by flow cytometry. (b) Interaction between the human Aggrus protein and hP2‐0 was estimated by SPR analysis. Five different concentrations of antibodies (6.25–100 nM) were passed over a sensor chip with the immobilized Aggrus protein for 1 min, before the flow was switched to the buffer alone for another 2 min in a single cycle. Equilibrium dissociation constants (K
D) are shown. P2‐0 (K
D = 9.30 x 10⁻⁹ M) [
 ]) and hP2‐0 (K
D = 2.12 x 10⁻⁸ M [
 ]). (c) CHO/Aggrus cells were incubated with control IgG or hP2‐0, followed by incubation with mouse platelets. PBS was added as a negative control (black line). Arrows indicate the time points from the reaction starting point to the half‐maximum value point. Control IgG (10 μg/mL,
  ), hP2‐0 (10 μg/mL,
  and 1 μg/mL,
  ). (d) CHO/Aggrus and HT1080 cells were incubated with control IgG and hP2‐0. Cell suspension was intravenously inoculated into BALB/c‐nu/nu (CHO, n = 10) or CB‐17/Icr‐scid (HT1080, n = 12 or 10) mice. After 20 (CHO) or 30 (HT1080) days, lung surface metastatic foci were counted. Bars, average. NS, not significant. **P < 0.005 by the Mann–Whitney U‐test.
