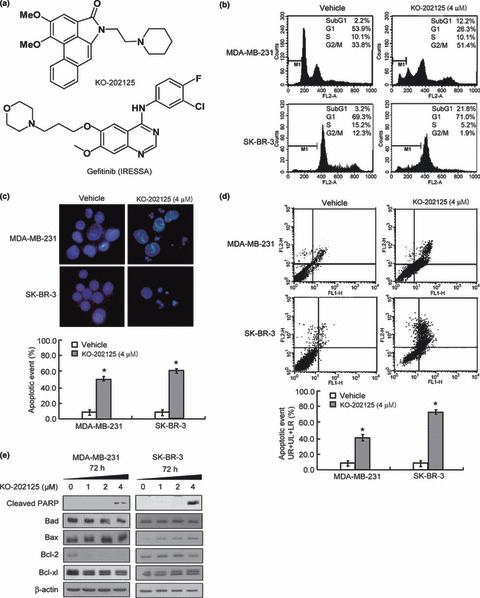
Figure 1.

The effect of KO‐202125 on cell growth and apoposis in MDA‐MB‐231 and SK‐BR‐3 human breast cancer cells. (a) Chemical structures of KO‐202125 (top) and gefitinib (bottom). (b) Cells were treated with vehicle or the indicated dose of KO‐202125 for 72 h and the sub‐G1 population cells were measured by FACS analysis. (c,d) Cells were treated with vehicle or KO‐202125 as above and the apoptotic body was measured by DAPI staining and annexin V staining, respectively. LR, lower right quadrant; UL, upper left quadrant; UR, upper right quadrant. (e) Cells prepared under the same conditions as above were subjected to western blot analysis with the indicated antibodies. All of the procedures were performed in triplicate and statistically analyzed with the Student’s t‐test. Data are presented as mean ± SD. *Statistically significant difference of P < 0.05.
