Figure 2.


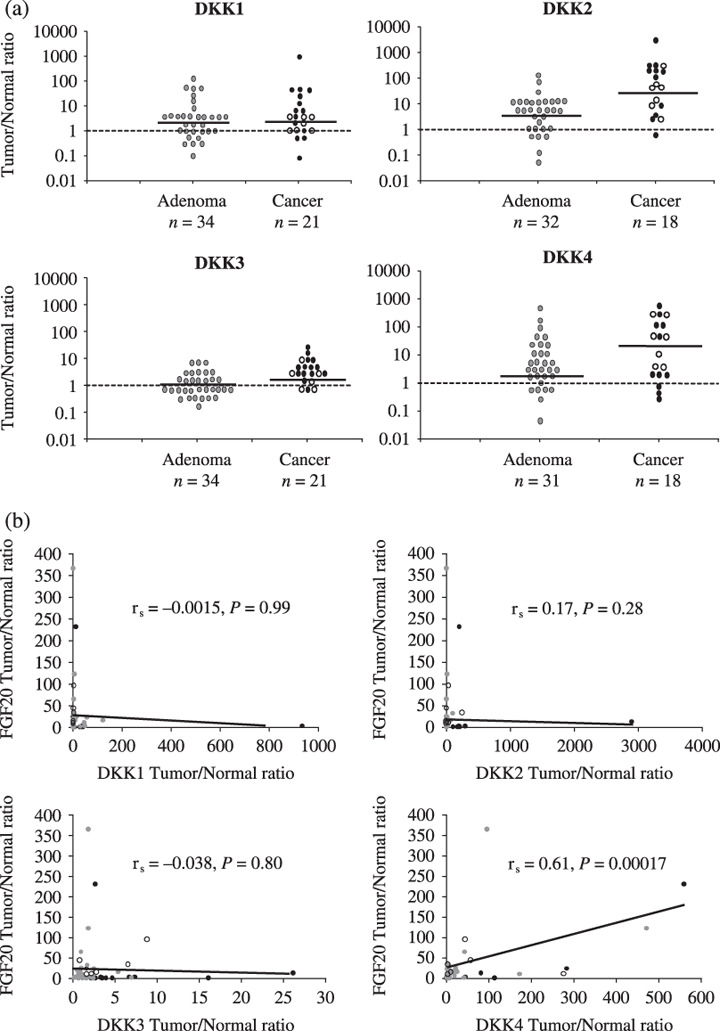
Expression profiles of Dickkopf (DKK) genes in colorectal tumors. (a) Expression level of each DKK family member in colorectal tumors measured by real‐time RT‐PCR.  , advanced cancer;
  , early cancer,
  , adenoma. The black horizontal line indicates the median in each group of subjects. The black dashed line indicates equal expression of DKK between tumor and normal mucosa. Data were analyzed with the Wilcoxon signed‐rank test. (b) The relationship between expression levels of DKK family members and fibroblast growth factor (FGF)‐20 in colorectal tumors. Data were analyzed for Spearman's correlation coefficient by rank testing (rs). A significant correlation between the levels of DKK4 and FGF20 was found. There was no such relationship between levels of DKK1, ‐2, ‐3, and FGF20.
  , advanced cancer;
  , early cancer;
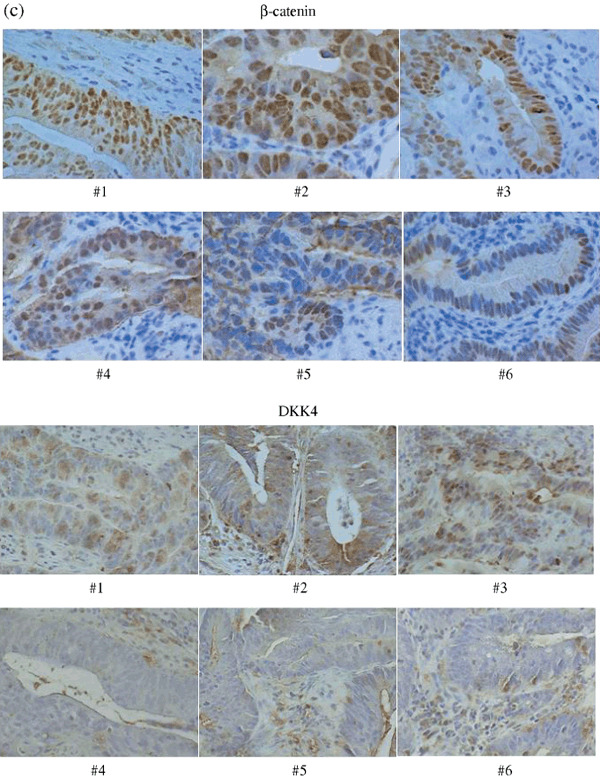
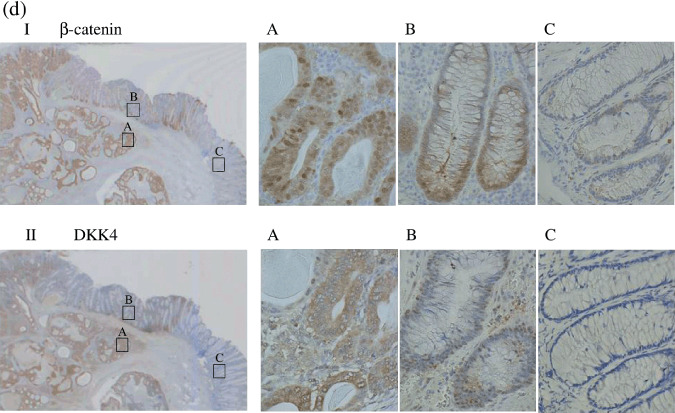
  , adenoma. (c) Immunohistochemical staining with β‐catenin and DKK4 antibody in primary colorectal cancers. All specimens were evaluated under a light microscope at ×400 magnification. There is a strong correlation between nuclear β‐catenin accumulation and expression of DKK4. #, sample number. DKK4 Tumor/Normal ratio: #1 559; #2 283; #3 81.2; #4 2.39; #5 2.21; #6 0.61. (d) Immunohistochemical staining with β‐catenin (upper panel) and DKK4 (lower panel) antibody in the specimen which was obtained by endoscopic mucosal resection showing: I, II, whole image; (a) invasive cancer with intense staining; (b) adenoma with weak staining; (c) normal mucosa with almost negative staining. Magnification a–c, ×400.
