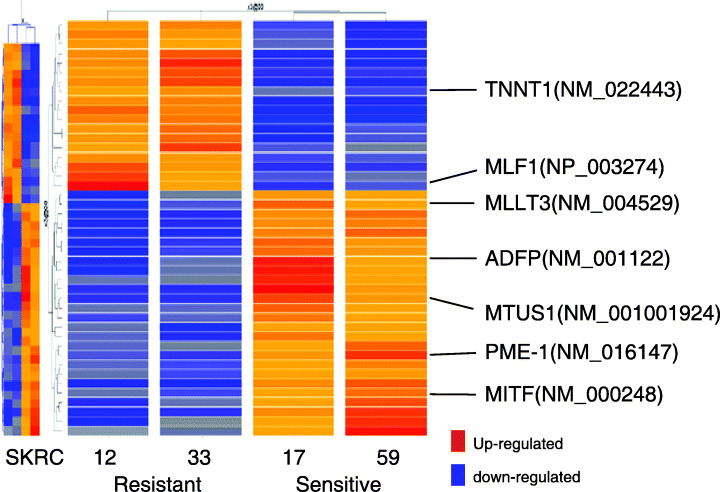
Figure 2.

Supervised hierarchical clustering analysis according to interferon‐α (IFNα) response showed that a total of 40 genes were different in IFNα‐sensitive lines (SKRC‐17 and ‐59) and ‐resistant lines (SKRC‐12 and ‐33). Among these 40 genes, seven were selected as candidates for predictors of IFNα sensitivity because gene expressions, as assessed by microarray, in the dynamic phase after IFNα treatment were increased or at least preserved in IFNα‐sensitive and ‐resistant groups.
