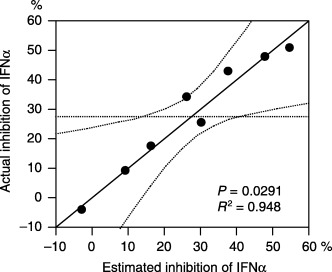
Figure 5.

Multiple linear regression analysis revealed that a combination of logarithmically transformed expression levels of ADFP, MITF, MTUS1, and TNNT1 correlated well with the growth inhibition rate assessed by WST‐1 assay at 1000 IU/mL of interferon‐α (coefficient = 0.948, P = 0.0291).
