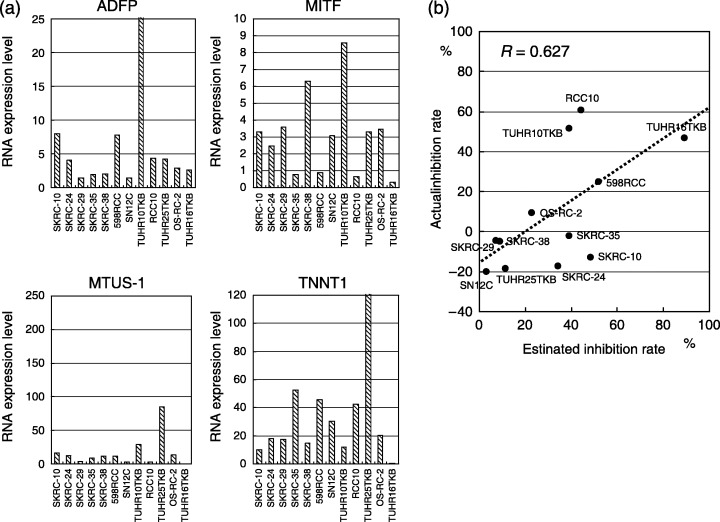
Figure 6.

Messenger RNA (mRNA) expression of four genes, ADFP, MITF, MTUS1, and TNNT1, assessed by quantitative polymerase chain reaction in six SKRC cell lines and six primary cultures from renal cell carcinoma (RCC) specimens (a). For validation of the model for prediction of interferon‐α response, inhibition rate of 12 RCC cells was calculated using relative mRNA expression level (b). Correlation between actual and estimated inhibition rate is considered to be statistically significant (r = 0.627).
