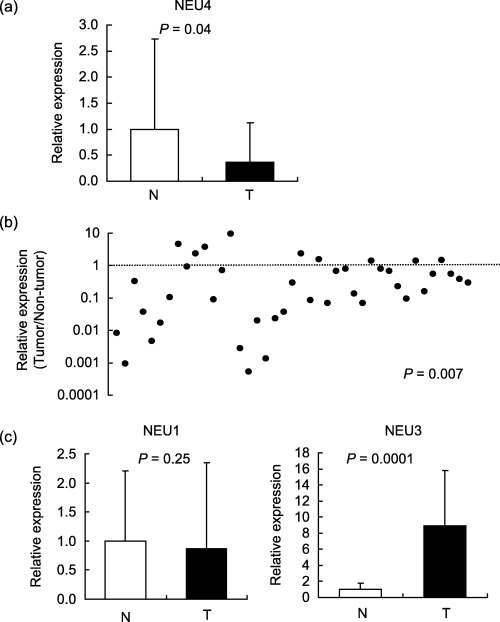
Figure 1.

NEU4 expression in colon cancers and non‐cancerous mucosa. (a) Relative NEU4 mRNA levels in 41 tumor and adjacent non‐tumorous tissues were evaluated by quantitative real time reverse transcription‐polymerase chain reaction (RT‐PCR) and normalized for sample variation by glyceraldehyde‐3‐phosphate dehydrogenase (GAPDH) expression. (b) The expression ratio of tumor to non‐tumor (T/NT) in each case was shown and most cases gave the values below 1. (c) NEU1 and NEU3 mRNA levels were measured in the samples used for NEU4 assays. P‐values were evaluated by the Student's t‐test.
