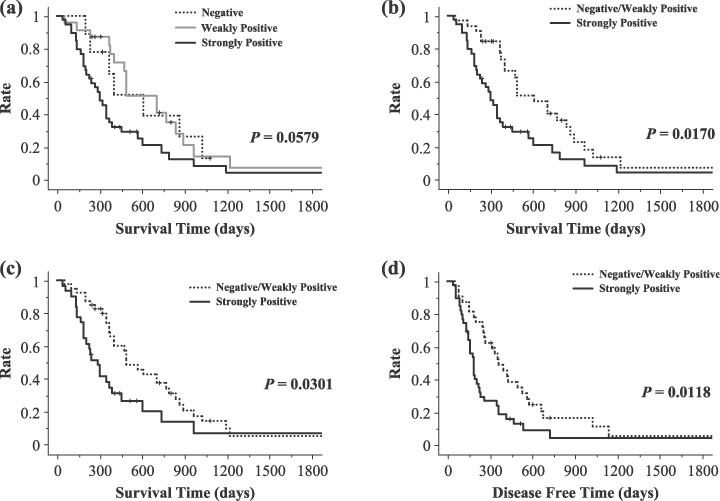
Figure 5.

Overall survival curves and disease‐free curve according to the level of intensity of LC3 protein expression in the peripheral area and the dominant overall intensity of LC3 expression. (a) Overall survival curves according to the level of intensity of LC3 expression in the peripheral area of the cancer tissue in a negative group, weakly positive group, and strongly positive group. There was a trend for patients with strongly positive expression of LC3 protein to have a poor outcome (P = 0.0579). (b) Overall survival curves according to the level of intensity of LC3 protein expression in the peripheral area of the cancer tissue in the negative and weakly positive group and the strongly positive group. The group with strongly positive expression of LC3 protein had a significantly shorter survival time (P = 0.0170). (c) Overall survival curves according to the dominant overall intensity of LC3 protein expression in the negative and weakly positive group and the strongly positive group. The group with strongly positive expression of LC3 protein had a significantly shorter survival time (P = 0.0301). (d) Disease‐free curves according to the level of intensity of LC3 protein expression in the peripheral area of the cancer tissue in the negative and weakly positive group and the strongly positive group. The group with strongly positive expression of LC3 protein in the peripheral area of the cancer tissue had a significantly shorter disease‐free period (P = 0.0118).
