
Figure 3.
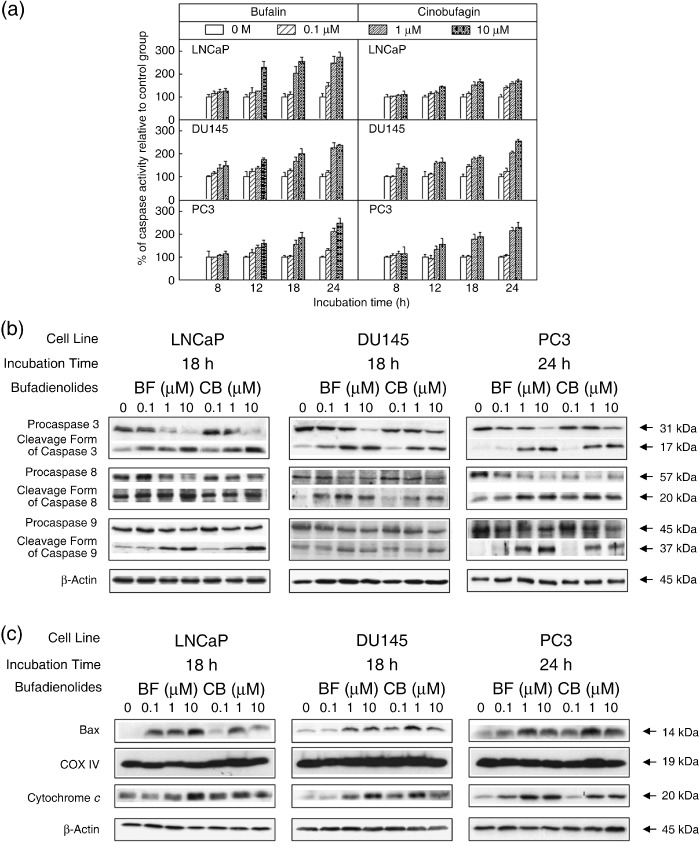
Caspase 3 activity and the protein expression of apoptosis‐related molecules in LNCaP, DU145, and PC3 cell lines after administration of bufalin (BF) or cinobufagin (CB). (a) Activity of caspase 3 was assayed using a colorimetric kit, and was determined after treatment at concentrations of 0, 0.1, 1, and 10 µmol/L for 8, 12, 18, and 24 h in three prostate cancer cell lines. Each value represents mean ± SEM. Control value = 100%. (b) After treatment with BF or CB for 18 (LNCaP and DU145) or 24 h (PC3), cell lysates were sized by 10 (caspase 9) or 15% (caspase 3 and 8) sodium dodecylsulfate–polyacrylamide gel electrophoresis (SDS‐PAGE). (c) Cell lysates were separated into mitochondrial and cytosolic fractions and subjected to 15% SDS‐PAGE and analyzed by western blotting. Each lane was loaded with 40 µg protein sample. Similar results were obtained in three other experiments.