
Figure 4.
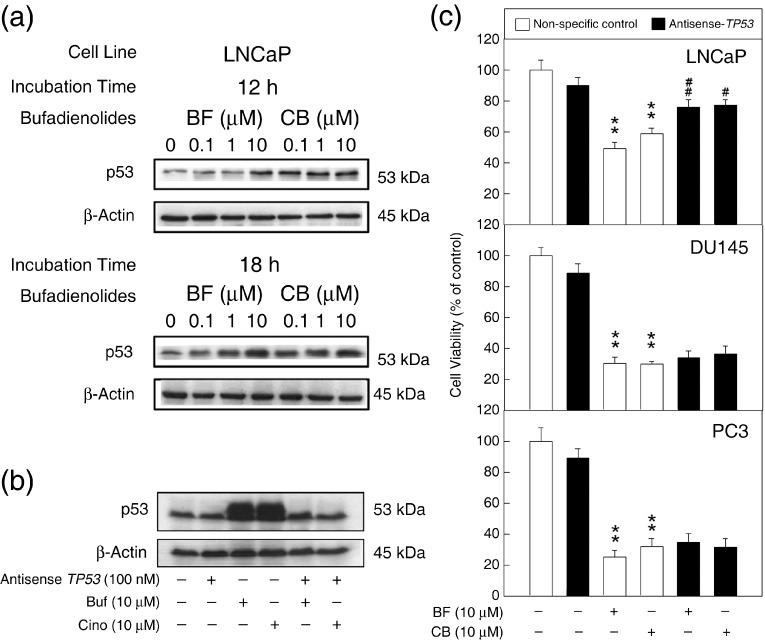
The role of p53 in the apoptotic pathway induced by bufalin (BF) and cinobufagin (CB) in LNCaP cells. (a) LNCaP cells were treated with BF or CB at concentrations of 0, 0.1, 1, and 10 µmol/L for 12 and 18 h. Whole‐cell lysates were sized by 10% sodium dodecylsulfate–polyacrylamide gel electrophoresis. (b) Cells were transfected with 100 nmol/L antisense TP53 for 48 h and then treated with BF or CB at a concentration of 10 µmol/L for 18 h. After administration, cancer cells were harvested and western blotting was carried out for the expression of p53. Each lane was loaded with 100 µg protein. Similar results were obtained in three other experiments. (c) Cell viability was measured by MTT assay. BF and CB were added to the medium after a 48‐h transfection. Open columns represent the non‐specific antisense RNA‐transfected group; closed columns represent the antisense TP53‐treated group. Control value = 100%; *P < 0.05, **P < 0.01 versus non‐specific antisense RNA‐control group; # P < 0.05, ## P < 0.01 versus non‐specific antisense RNA plus BF or CB groups.