
Figure 6.
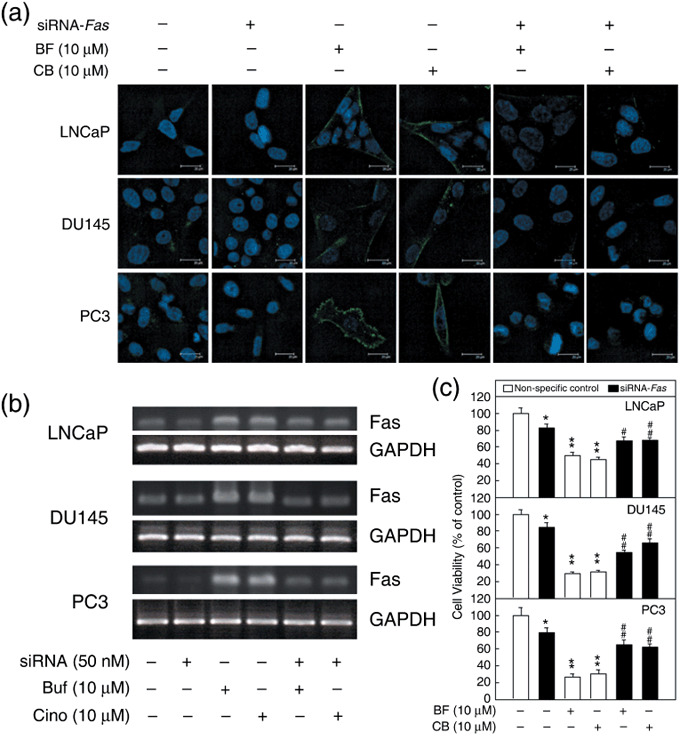
Fas expression and cell viability in Fas small interfering RNA (siRNA)‐transfected prostate cancer cells after treatment with bufalin (BF) and cinobufagin (CB). (a) Cells were transfected with 50 nmol/L siRNA for 48 h then treated with BF or CB at a concentration of 10 µmol/L for 18 (LNCaP and DU145) or 24 h (PC3). The protein expression of Fas induced by BF and CB was inhibited after Fas siRNA transfection. Scale bar = 20 µm. (b) The mRNA of transfected cells was extracted and analyzed by reverse transcription–polymerase chain reaction. The mRNA expression of Fas elevated by BF and CB was downregulated. (c) Cell viability was measured by MTT assay. BF and CB were added to the medium after a 48‐h‐transfection. Open columns represent the non‐specific siRNA‐transfected group; closed columns represent the Fas siRNA‐treated group. Control value = 100%; *P < 0.05, **P < 0.01 versus non‐specific siRNA control group; # P < 0.05, ## P < 0.01 versus non‐specific siRNA plus BF or CB groups. GAPDH, glyceraldehyde‐3‐phosphate dehydrogenase.