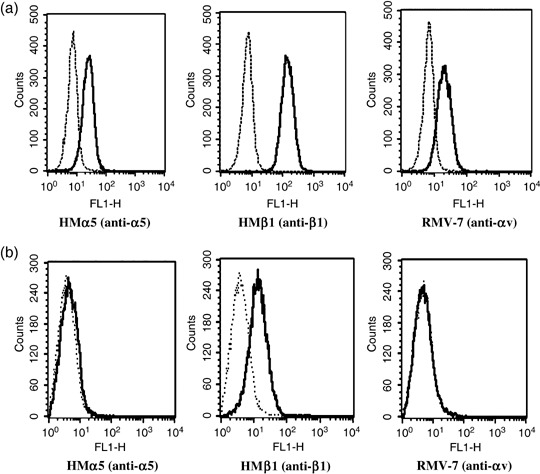
Figure 1.

Expression of α5, β1 and αv integrins on (a) Lewis lung cancer (LLC) and (b) KLN205 cells. Integrin expression was assessed with flow cytometric analysis. The dotted lines indicate background fluorescence intensity. The solid lines indicate the fluorescence intensity of α5 (HMα5: left), β1 (HMβ1: middle) and αv (RMV‐7: right) integrin, respectively.
