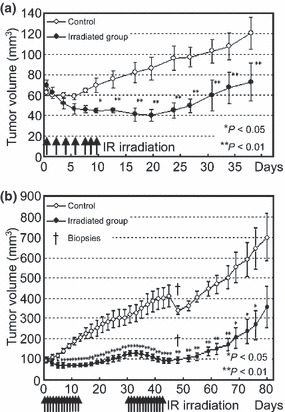
Figure 4.

Relative tumor volume in MCF7 (a) and MDA‐MB435 (b) cells. Significant differences were observed in MCF7 tumor volume between the control and infrared (IR)‐irradiated group from Days 9 through 37, when the animals were euthanized. Significant differences were observed in MDA‐MB435 tumor volume between the control and IR‐irradiated groups from Day 5 up to Day 77. Significant differences are indicated (*P < 0.05, **P < 0.01). Cross sign indicates when two animals of each group were euthanized for histological investigation (Day 45).
