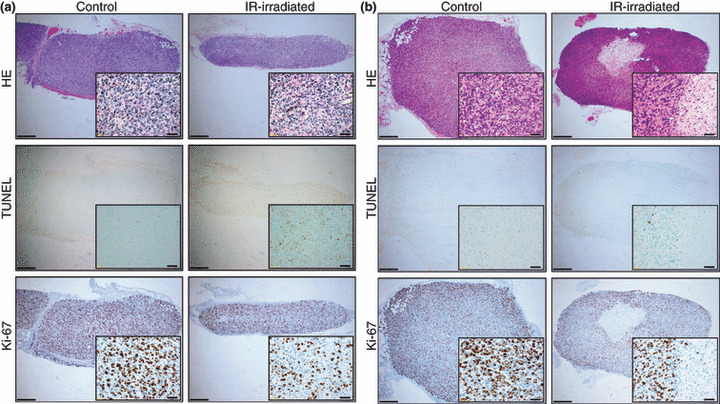
Figure 5.

The horizontal sectional histology of control and infrared (IR)‐irradiated MCF7 breast cancer cells on Days 13 (a) and 37 (b). The left column shows control tissues, and the right column shows IR‐irradiated tissues. Images from top to bottom show hematoxylin–eosin staining, TUNEL technique, and immunohistological staining using Ki‐67. Scale bars = 400 μm (magnification: ×40). Insets: scale bars = 40 μm (magnification: ×400).
