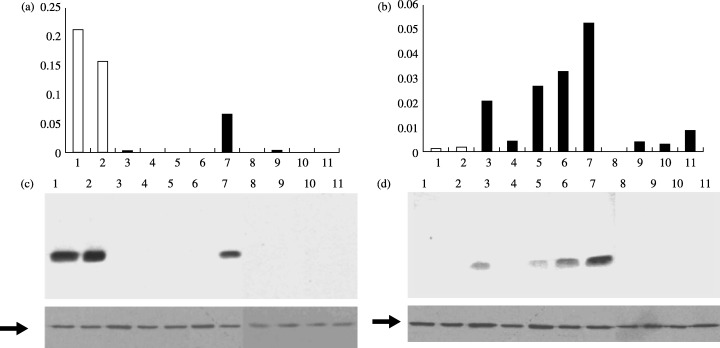
Figure 1.

Expression analyses of S100A2 and S100A4 in bronchial epithelial cells (NHBE and SAEC) and nine lung adenocarcinoma cell lines. Levels of S100A2 (a) and S100A4 (b) mRNA were determined by real‐time reverse transcription–polymerase chain reaction analyses. Protein levels of S100A2 (c) and S100A4 (d) were examined by western blot analysis. The lower panels in (c) and (d) represent β‐actin expression (arrows) serving as an internal control. Lanes: 1, NHBE; 2, SAEC; 3, LC‐2/ad; 4, ABC‐1; 5, A549; 6, H460; 7, HLC1; 8, H1299; 9, PC3; 10, VMRC‐LCD; 11, RERF‐LC‐KJ.
