
Figure 5.
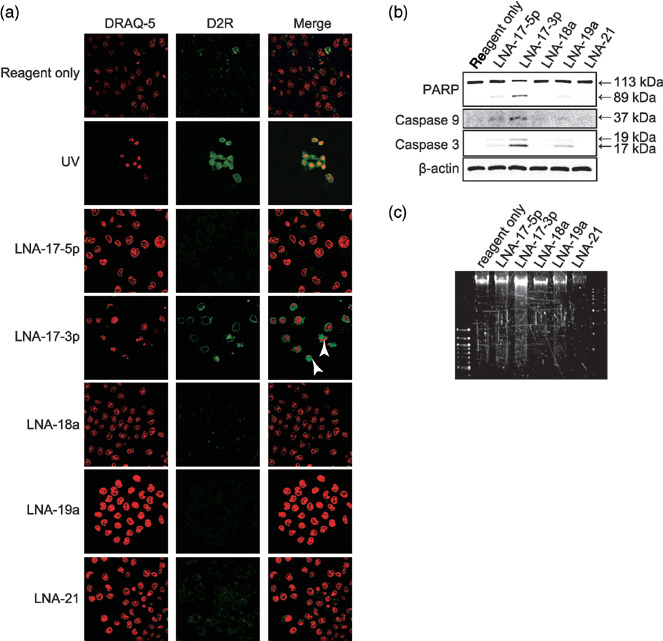
Effect of miR inhibitors on apoptosis in ARO cells. ARO cells were transfected with indicated miR inhibitors. (a) Images were obtained at 72 h after transfection (24 h after second transfection). D2R and DRAQ‐5 were excited with 488 and 633 nm lasers, respectively. Representative images are shown. Nuclear fragmentation is indicated by arrowhead. UV exposure was used as a positive control. (b) Cells were harvested at 72 h after transfection (24 h after second transfection), and Western blot analysis was performed using indicated primary antibodies. β‐actin was used as a loading control. (c) Agarose gel electrophoresis of DNA extracted from the cells used in (b). Similar results were observed in three independent experiments.